Report to: Board
Report of: Chief People Officer
Part 1: ü
Date: 6th February 2025
Prepared by: E Hickman
For Information:
Executive Summary:
The purpose of this report is to present the findings and recommended actions based on the Gender Pay Gap report for 2024. The gender pay gap for our Trust is below the threshold for immediate action, as specified by the Equality and Human Rights Commission, and so should be regularly monitored.
In summary it was found that 75% of our workforce is female, with women occupying 75% of the lowest paid jobs and 67% of the highest paid jobs. The median gender pay gap was found to be at 3.20% which has remained static as reported in 2023. The Equality and Human Rights Commission set out in their criteria that where a pay gap is greater than 3% but less than 5% difference, the position should be regularly monitored,
The ability for us as an organisation to take targeted action is limited due to being bound by NHS terms and conditions, the fact that we encourage colleagues to take up flexible working opportunities which then reduces salary levels and the pipeline of newly qualified individuals who are seeking to obtain posts with us such as higher proportion of females wanting a consultant position, higher proportion of males seeking employment in agenda for change caring professions.
This report details the findings analysis and subsequent proposed actions.
It is recommended that the Board
- Receives and notes the report.
- Approve the report for publishing on our Trust internet site by 30 March 2025
Previous consideration
From April 2017, gender pay reporting legislation requires employers with 250 or more employees to publish statutory calculations each year showing how large the pay gap is between their male and female employees at the end of March. Employers must publish their gender pay gaps both on their own website as well as a government website.
Gender pay reporting is different to equal pay; equal pay deals with the pay differences between men and women who carry out the same jobs, similar jobs or work of equal value whereas the gender pay gap shows the difference in the average pay between all men and women in a workforce. The Equality Act 2010 sets out that men and women in the same employment, performing equal work, must receive equal pay, it is unlawful to pay people unequally because of gender. If a workforce has a particularly high gender pay gap, this can indicate that there may be a number of issues to deal with, and the six mandated calculations may help to identify what those issues are.
Lancashire Teaching Hospitals as an employer must publish six calculations showing our:
- Average gender pay gap as a mean average
- Average gender pay gap as a median average
- Average bonus gender pay gap as a mean average
- Average bonus gender pay gap as a median average
- Proportion of males receiving a bonus payment and proportion of females receiving a bonus payment
- Proportion of males and females when divided into four groups ordered from lowest to highest pay
The Equality and Human Rights Commission has the power to enforce any failure to comply with the regulations. The Equality and Human Rights Commission states that where there is a difference in pay related to the gender of an employee, the following applies:
Less than 3% difference, no action is necessary,
- Greater than 3% but less than 5% difference, the position should be regularly monitored,
- Greater than 5% difference, action should be taken to address the issue and close the gap.
The average gender pay median is the figure which will be used as the most accurate indicator of pay to determine if further action is required.
THE WORKFORCE PROFILE
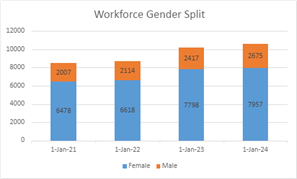
Image description for accessbility purposes
The image shows a graph with a title of 'Workforce Gender Split. The x axis has 4 column bars with blue at the bottom and red at the top. The label under each column shows 01-Jan-21, 01-Jan-22, 01-jan-23 and 01-Jan-24 The key at the bottom shows that the blue represents female and the top represents male. The y axis shows numbers from zero to 12000 in increments of 2000. The first bar has 6478 (female) in the blue part and 2007 (male) in the red (top) part. The second bar has 6618 in the blue part and 2114 in the red (top) part. The third bar has 7798 in the blue part and 2417 in the red part. The fourth 7957 in the blue and 2675 in the red.
Figure 1: Gender profile
The gender profile of our workforce (Figure 1) continues to be predominantly female. The current (31 March 2024) split within the overall workforce remains consistent with the previous four Gender Pay Gap reports: 75% female, 25% male
Table 1 – Proportion of females and males when divided into four groups from lowest to highest pay (full-pay relevant employees only)
|
Quartile |
2024 | 2023 | 2022 | 2021 | ||||
|---|---|---|---|---|---|---|---|---|
| No. Male | Female | % Male | Female | No. Male | Female | % Male | Female | No. Male | Female | % Male | Female | No. Male | Female | % Male | Female | |
| 1 - Lower | 662 | 1193 | 25% | 75% | 582 |1968 | 23% | 77% | 102 | 1681 | 23% | 77% | 467 | 1654 |
22% | 78% |
| 2 - Lower middle | 632 | 2026 | 24% | 76% | 579 | 1976 | 23% | 77% | 494 | 1689 | 23% | 77% | 457 | 1665 | 22% | 78% |
| 3 - Upper middle | 505 | 2154 | 19% | 81% | 469 | 2084 | 18% | 82% | 379 | 1084 | 17% | 83% | 385 | 1736 | 18% | 82% |
| 4 - Upper | 876 | 1784 | 33% | 67% | 7887 | 1770 | 31% | 69% | 739 | 1444 | 34% | 66% | 698 | 1423 | 33% | 67% |
| Total | 2675 | 7957 (10632 total) |
25% | 75% |
2417 | 7798 |
24% | 76% | 2114 | 6618 (8732 total) |
24% | 76% | 2007 | 6478 (8485 total) |
24% | 76% |
To determine the proportion of employees in each quartile pay band, the following steps were used:
1) List all employees and sort by hourly rate of pay.
2) Divide the list into four equal quarters.
3) Express the proportion of male and female employees in each quartile band.
When analysing the percentage split of each gender workforce by quartile, it is evident that the greatest proportion of the male workforce occupies the upper quartile (33%) compared to the lower quartiles. The greatest proportion of the female workforce occupies the upper middle quartile (81%) with the lowest proportion (67%) of females occupying the upper quartile.
OUR GENDER PAY GAP
| Women's earnings are: | |
| Mean gender pay gap in hourly pay | 22% lower |
| Median gender pay gap in hourly pay | 3.2% lower |
| Difference in mean bonus payments | 35.9% lower |
| Difference in median bonus payments | 0% |
| Women earn 78p for every £1 earned by Men | |
Table 3 - Average gender pay gap as a mean average for Trust overall
| Mean Hourly Rates | Male | Female | Difference | % Difference |
|---|---|---|---|---|
| 2024 | £24.02 | £18.59 | £5.43 | 22.0% |
| 2023 | £21.68 | £17.13 | £4.55 | 21.0% |
| 2022 | £24.69 | £16.87 | £7.81 | 31.7% |
| 2021 | £22.14 | £16.00 | £6.14 | 27.7% |
| 2020 | £21.79 | £15.51 | £6.29 | 28.8% |
| 2019 | £20.73 | £15.11 | £5.62 | 27.1% |
Looking at the 2024 figures, the difference in the median pay for males and females is 3.2%, the same as it was in 2023. This represents a marked change from 6.8% in 2022 and now remains within the bracket for ‘regular monitoring’.
PROPORTION OF ELIGIBLE MALE AND FEMALE STAFF WHO RECEIVED A BONUS (CEA)
The data presented in tables 5, 6 and 7 details the clinical excellence bonuses paid to staff split by gender and provides the mean and median bonuses paid. The data also shows the proportion of males and females overall who received a bonus.
The findings presented indicate a mean bonus pay gap between males and females of 35.9% in 2024 a decrease from 45.9% the previous year. Since COVID, the usual CEA application and selection process for medical consultants has been set aside, with all eligible consultants being awarded an equal payment of £3,014.84. This resulted in no median bonus pay gap in 2022 - 2024.
The data also indicates that in 2024 the total number of female employees has decreased from 2023 numbers whilst the number of male employees has increased yet slight more male and female employees were awarded a bonus than in the previous year.
Table 5 - Bonus paid as a mean average split by gender
| Mean Bonus | Male | Female | Difference | % Difference |
|---|---|---|---|---|
| 2024 | £8,213.47 | £5,269.13 | £2,944.34 | 35.9% |
| 2023 | £8,534.87 | £4,621.28 | £3,913.59 | 45.9% |
| 2022 | £10,441.88 | £6,888.05 | £3,553.83 | 34.0% |
| 2021 | £15,721.28 | £11,812.87 | £3,908.42 | 24.09% |
| 2020 | £16,134.24 | £10,900.69 | £5,233.55 | 32.4% |
| 2019 | £16,057.62 | £11,627.67 | £4,431.95 | 27.6% |
Table 6 - Bonus paid as a median average split by gender
| Median Bonus | Male | Female | Difference | % Difference |
|---|---|---|---|---|
| 2024 | £3,014.84 | £3,014.84 | £0.00 | 0% |
| 2023 | £2,316.00 | £2,316.00 | £0.00 | 0% |
| 2022 | £3,818.66 | £3,818.66 | £0.00 | 0% |
| 2021 | £9,145.29 | £6,032.04 | £3,113.25 | 34.0% |
| 2020 | £12,063.96 | £6,032.04 | £6,031.92 | 50.0% |
| 2019 | £9,801.99 | £5,991.50 | £3,810.5 | 38.9% |
Table 7 - Proportion of males receiving a bonus payment and proportion of females receiving a bonus payment
| 2024 | Total head count paid Bonus | Total No. of relevant employees | % paid bonus |
|---|---|---|---|
| Male | 240 | 3125 | 7.68% |
| Female | 122 | 9403 | 1.30% |
| 2023 | Total head count paid Bonus | Total No. of relevant employees | % paid bonus |
| Male | 230 | 3035 | 7.58% |
| Female | 111 | 9622 | 1.15% |
| 2022 | Total head count paid Bonus | Total No. of relevant employees | % paid bonus |
| Male | 233 | 2203 | 10.6% |
| Female | 101 | 7195 | 1.4% |
| 2021 | Total head count paid Bonus | Total No. of relevant employees | % paid bonus |
| Male | 109 | 2072 | 5.3% |
| Female | 31 | 6926 | 0.4% |
FINANCIAL IMPLICATIONS
None
LEGAL IMPLICATIONS
None
RISKS
The gender pay gap is below the threshold for immediate action (as specified by the Equality and Human Rights Commission) however regular monitoring is recommended.
IMPACT ON STAKEHOLDERS
Not applicable
RECOMMENDATIONS
The gender pay gap is 3.20% which means no immediate action is required, however we do need to regularly monitor, as specified by the Equality and Human Rights Commission. As noted in previous Gender Pay reports, it is a challenge to identify clear actions which make a tangible difference, as in part our policies and processes (in some cases) work against us achieving a fairer gender pay balance. For example, we actively encourage our colleagues to work flexibly and, aligned to the NHS People Plan, we advertise all our vacancies as having access to flexible working opportunities from day one. Given flexible working is seen as an employee benefit, we want colleagues to take advantage of this, however it may have a negative impact on the gender pay gap, due to the higher proportion of our workforce being female overall and with females tending to work more within part time roles.
Other challenges we face as an organisation is the pipeline of newly qualified candidates coming through degree courses and seeking employment with us. If Universities are unable to attract higher numbers of males into agenda for change professions and higher numbers of females into medical and dental professions then it makes it more challenging for us to be able to alter our gender split and ultimately the gender pay gap.
In spite of this, as an organisation we are seeking to encourage a more diverse pool of candidates to apply for our unregistered professions such as HCA, roles in Estates and Facilities at bands 2 and 3, as this is something we as an organisation can take positive action towards, specifically in the recruitment of a higher proportion of males into more ‘traditionally female’ roles, given the fact that males in our organisation in an agenda for change role earns less than females. We have created a diverse multimedia campaign for HCA roles, where we use staff stories to help illustrate what colleagues enjoy about their work to enable potential candidates of different genders, ages, sexual orientation and ethnic backgrounds to see themselves in our teams.
More widely, actions we are planning on taking which for part of Our People Plan 2023 – 2026 include a refreshed talent management offer to accommodate different development needs, particularly for those colleagues’ bands 8a or above, or for those who have been identified as a rising star over several years but have yet to secure a more senior position for whatever reason. We are also raising the visibility of the different challenges women may face such as via the menopause programme of work, working towards becoming an endometriosis friendly employer, promoting awareness around colleagues who have caring responsibilities alongside their employment to help demonstrate that we are accepting, and accommodating of different needs women may have and how these will hopefully not be a barrier to women seeking career progression within our organisation.
It is recommended that the Board;
- Receive and note the report
- Approve the report for publishing on our Trust internet site by 30 March 2025